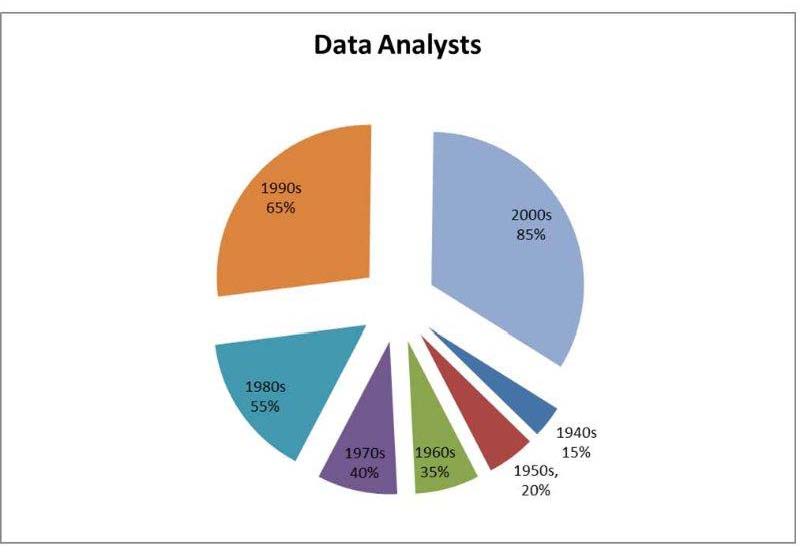
Beginning at the first half of the twentieth century, companies revisited the 1940’s strategy pioneered by Robert McNamara. Under this strategy, McNamara and his colleagues applied statistical techniques to large databases, such as those of the US Department of Defense and the Ford Motor company to garner the insights necessary to improve organizational efficiency and performance (Edwards, 2013). During this epoch, data scientists and information analysts collaborated by using progression or regression data analysis in projecting gleaned bit of datasets for competitive and comparative advantages(see the table below).
 Table 1: Moving exponentially from bit to Yottabyte
Source: Aluya and Garraway, 2014 at the aluyainsitute.com
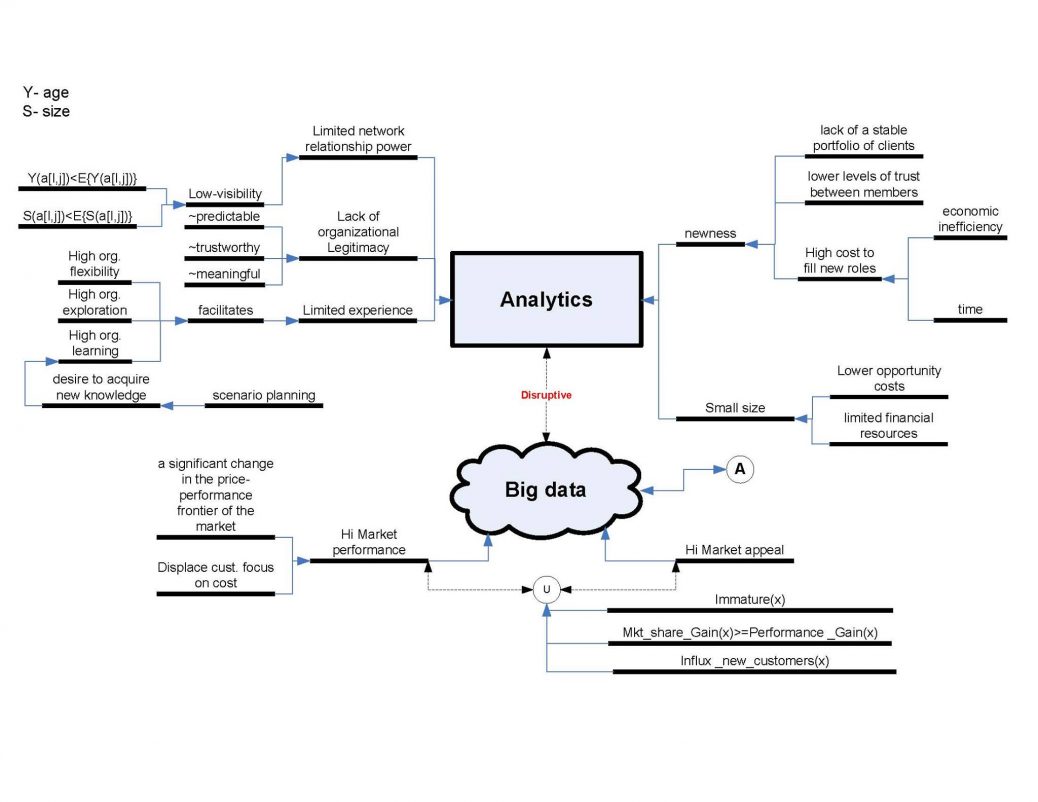
Eventually these companies mentioned above began applying sophisticated analytical techniques to large datasets by transforming pertinent information subject to a reasonable balance between relevance and particularity. Evidently, these collaborative practices led to the term “Big Data” and it was used to describe when the data available exceeded the capacity of the prevailing technologies. The prevailing technologies were slow to catching up with the volumes of data streaming into businesses (Overly, 2012; Watters, 2012). Anecdotally, it was akin to a room that used to accommodate one person now having hundreds and thousands of people trying to get in and be comfortable. Effectively, big data in all purpose and practicality invoked the totality of structured and unstructured data sources (Berg, 2012; Gobble, 2013; Gruenspecht, 2011). It suffices to say that many of the refined techniques were steeped in academic disciplines like climate science, economics, genetics, astrophysics, finance, data science and engineering all of which were used to facilitate problem solving by providing the appropriate lenses with which to view the complexities surrounding problems (Aluya and Garraway, 2014, 2014a; Gadney, 2010). When applied, such techniques promoted a data-driven exploratory approach over a theory-driven hypothesis testing approach (Press, 2013; Brill, 1999; Tukey, 1977). Ultimately, the main objective of big data has been to provide insights that tailored solutions to customer requirements. The seamless synergic collaboration of the DA, DS and IA depended on how entrepreneurs used the gleaned actionable data for profit. Read more here at http://tinyurl.com/nky952l
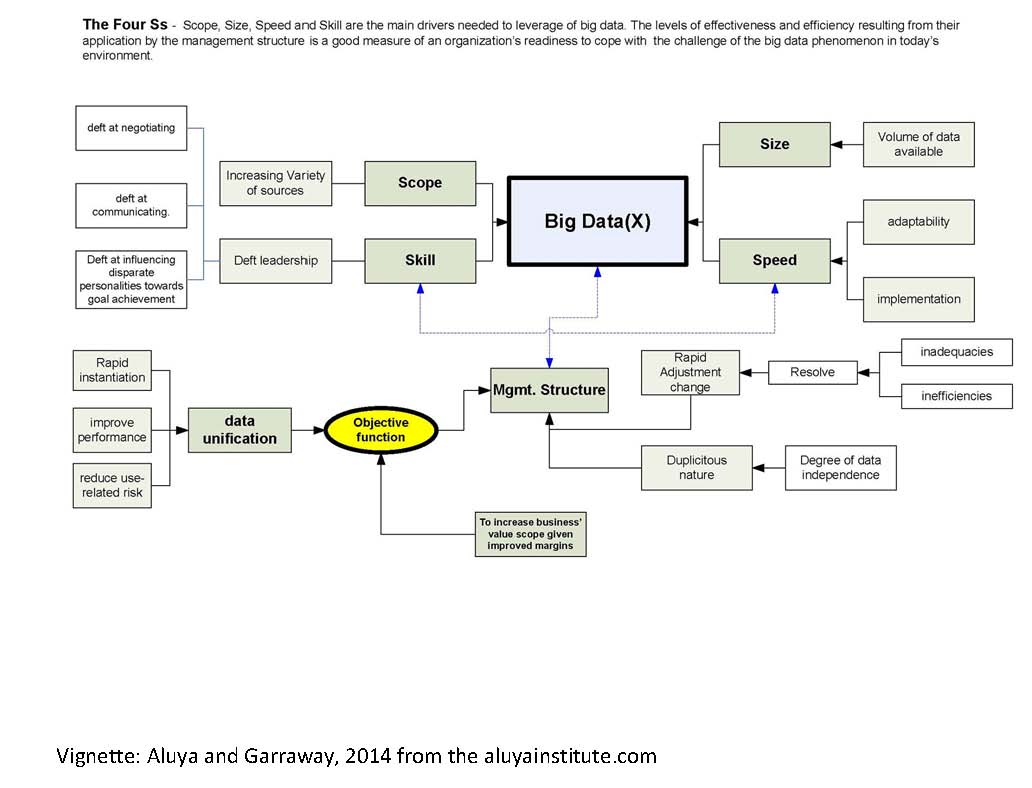
In the post twentieth century era, the explosion of smart devices, sensors, intelligent machines and social communication technologies like Twitter Inc. and Facebook Inc., increased the variety of formats and database models used to parse and store the data available. These explosions were due to TSHs. These formats and database models have resulted in the proper interpretation of large datasets and proper analysis through the prism and collaboration of the DA, DS and IA. With respect to data in motion and the speed of data, the shelf life of data collected has been decreasing due to the continuous updating from stream-smart computing technologies. With intelligent machines processing of big data has demanded the continual performance of advance analytics on data in motion. For example in the financial industry, Sarbanes-Oxley compliance has been extended to the use of big data in connection with certifying the accuracy of financial statements under Section 302, “Corporate responsibility and Financial Reports” (Eaton, and et al, 2012; Jarausch and Hardy, 1991 ). Using the argument of big data’s identity paradox (Richards and King, 2013), the mass explosion of certain types of data collection like phone records, surfing history, buying history, social networking posts etc., established identity profiles of individuals based on their desires, likes, dislikes, socio-economic habits etc. However here is our ground-up conceptualization of the big data. Read more here or get the references here at http://tinyurl.com/lz45vxn

Conceptualization of the 4Ss (Aluya and Garrraway, 2014)
Source: Aluya and Garraway, 2014 at the aluyainsitute.com


